An Australian Construction Industry Slowdown? How Best to Prepare and Minimise Project and Operational Risk

Most construction industry stakeholders and experts agree that further pain is ahead for the Australian Construction Industry with current economic conditions and looming recessionary forecasts, along with sustained supply chain and labour issues, driving expected industry contraction in 2023 (-2.6%) and marginal growth in 2024 (0.6%).

This is hard news to hear for an industry that already accounts for 31% of all insolvencies; and with overall accumulation of debt above 60 days trending upward, insolvencies are likely to increase, at least in the short term.

The largest impact will continue to be felt in the residential construction sector which has already seen a number of large firms including Porter Davis, Probuild, Condev, Waterford Homes and Pivotal Homes enter insolvency; not forgetting the flow on impact to hundreds of subcontractors and homeowners.

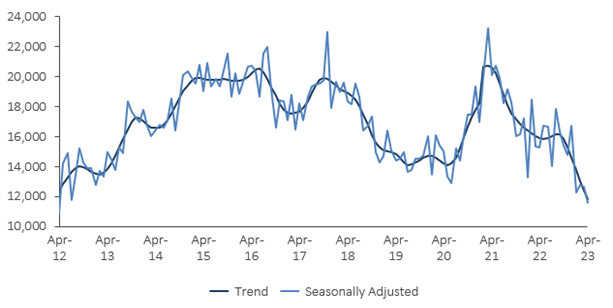
Recent issues associated with the bad marriage between over-populated and government stimulated residential pipelines, and a 17% increase in overall housing input costs, have started to subside. However, these issues are unfortunately being replaced by rising interest rates and the associated lowest level of new home purchasing or construction since 2012 (Figure 1).

Figure 1: Dwelling Units Approved in Australia (Source: ABS)

Even the industrial and heavy industry sectors, which have been buoyed by increased levels of government investment in new infrastructure projects, as well as the rebound of mining commodity prices, won’t be able to escape some of the pain ahead.

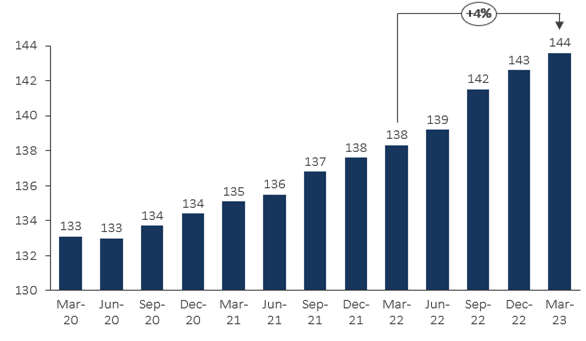
Although the start of 2023 has seen infrastructure material costs begin to flatten as many of the post COVID logistics and supply chain issues resolve, rising energy prices and continued inflationary pressures means that some cost uncertainty still remains. Additionally, as material costs have flattened, labour costs have grown by 4% in the last year alone as a result of ongoing skilled and unskilled shortages (Figure 2). With numerous infrastructure mega-projects currently underway across the country, these labour shortages will not only drive increased cost on traditionally small margins, but also impact the ability to meet project timelines.

Figure 2: Australian Labour Cost Index (Source: ABS)

The outlook however is not all negative, with the industry expected to record an average annual growth of 3.1% from 2024 to 2027 and medium to long term industry fundamentals remaining strong.

With falling housing vacancy rates, and the need for increased immigration to alleviate labour shortages across multiple sectors, residential construction growth will likely return within the short to medium term. Investment is likely to be focused on multi-residential and high-density apartment and townhouse projects, providing a needed boost for builders and subcontractors. Furthermore, once inflation is contained, interest rates are expected to moderate providing incentives for developers, homeowners and lenders to invest again in the detached housing market.

Additionally, $9.6 billion of investment in infrastructure projects across the next four years will be followed by over $120 billion in allocated investment in transport infrastructure projects in the following 10 years; providing the industrial and heavy industry sector with a very positive outlook ahead.

Hence whilst there may be further pain ahead in the short term, including the further demise of some large players, the longer-term outlook means that there are strong growth opportunities for those who best prepare for and effectively manage their commercial and operational risk over the next 12-18 months.

Opportunities to React and Benefit

To come out the other side of the downturn in the best position to capture available growth and market share, companies must start applying industry best operational, commercial and risk management practices. Three key areas of best practice which deliver strong ROI include:

1.     Improving Procurement Practices

The power of procurement as lever to improve productivity and help mitigate pipeline, supply chain and labour uncertainties, has been consistently proven across recent construction industry cycles. Our work with clients across the sector has highlighted that companies with the best procurement practices have margins 5-10% higher than those with lower maturity; and that over 10% savings are available to those who apply these best practices.

Some fundamental best practices include:

  1. Reviewing contracts and ensuring that terms and risk mechanisms best reflect operational conditions: This can be as simple as adding rise and fall clauses to standard building contracts that allow fixed price sums to change based on cost fluctuations; to the application of more collaborative contract types and terms focused on integrated project delivery (IPD) and the re-allocation of risk to maximise working efficiencies and enable the collaborative sharing of delivered upside.
  2. Consolidating contractors and suppliers and building longer-term relationships: The generation of stronger and longer-term relationships improves procurement function collaboration, driving improved value for money and project related outcomes. Additionally, these relationships help build supply chain resilience, de-risking the common supply chain issues that have recently been felt across the industry.
  3. Recontracting for what is coming, not based on what has happened: When establishing new contracts, procurement functions should be continually reviewing industry and economic conditions and applying this knowledge to procurement risk management plans. These risks should then dictate the type of contractual arrangements entered into, and the levels of due diligence required during the tendering, sourcing and supplier management phases to ensure adequate risk mitigation.

2.     Rethinking Project Controls

The economic impact of COVID, followed by the post COVID construction surge, saw many builders desperately trying to just land and complete projects whilst struggling to manage the complexities brought on by supply chain and immigration constraints and cost inflation; let alone put in place effective project controls. However, with the impacts of the industry slowdown already widespread, effective project controls can not only help ensure survival but also provide the margin protection and cashflow required to invest in capturing the growth potential on the other side.

The first key step to improving project control effectiveness and maturity is to ensure all the basics are in place from the very start of the project life cycle. This includes making sure that a robust and standardised stage gate process is established that ensures that project risks are identified, eliminated and or mitigated before they can impact project cost, schedule or margin. It is also imperative that the right cross-functional stakeholders are identified and engaged at each project stage to maximise the availability of the information that is required to generate a true understanding of project performance and drive informed decisions.

Once the basics are in place the next step is to leverage data and technology to improve the efficiency and cost of understanding and assessing performance; and transition from just proactively managing the risks associated with underperformance to also identifying, accelerating and replicating areas of overperformance and opportunity. To help reach this level of maturity a robust project management system such as PCG’s Make It Happen solution is essential, enabling all types of project stakeholders to efficiently provide information for automatic consolidation and the provision of a view of performance at any project level.

3.     Applying a Lean Construction Culture

Lean Construction practices are rapidly growing in popularity to combat the low levels of productivity improvement that have been observed within the industry over the past 20 years; averaging only 1% per annum compared to 3% for the total economy. The application of Lean Construction practices provides another mechanism to de-risk short to medium term market conditions by decreasing fixed and project costs, improving project delivery throughput and maximising project visibility and control.

However, too often companies are observed applying Lean tools and practices and not realising expected benefits, or ways of working eventually reverting to old practices and initial gains lost. This is because the true potential of Lean can never be fully realised until Lean becomes the core of an organisation’s culture. This fact can be most prominently observed within the practices of Toyota, the founding Lean company, whose people are empowered with the skills and toolkits to apply Lean practices in all areas of their work – the outcome being gradual and sustainable improvement every day.

To build a Lean culture, construction companies must invest in their people and their contractors, providing them with the awareness, training and mentoring to understand the value that Lean can deliver. They must also provide them with ownership of their work area, enabling them to proactively identify and remove waste, and share the outcomes across the organisation so that new processes and associated benefits can be embedded and replicated on all projects going forward.

Need Help to React First?

Our specialised industry and practice teams at Pacific Consulting Group can rapidly undertake an assessment of your current practices and best practice maturity, helping to identify the key areas of improvement that will help your organisation to both manage the changing industry conditions better than the rest and capture available growth opportunities on the other side.

Our superior analytics, commercial focus, and industry experience have allowed us to deliver outstanding outcomes for clients at all levels of organisational maturity.

Contact us to find out more about how we can help you to prepare best for what is ahead.

The role of the PMO; How they fulfil responsibilities whilst overcoming challenges


With the seismic shifts caused by Covid-19 and the challenges businesses have faced in transforming and adapting to these changes, the value of a high performing Programme Management Office (PMO) has once again been brought to the forefront. Throughout the pandemic, high-performance PMOs have proved their value by coordinating, coaching, and challenging their business throughout these large-scale changes to ensure the ‘burning platform’ is clearly communicated and the required transformation is delivered effectively.


What exactly is the role of a Project Management Office (PMO)?

Commonly described as the backbone of any successful and stable enterprise, the PMO sets the standards for projects and allocates resources efficiently to ensure individual projects and larger programmes run effectively. Working at an enterprise level the PMO is responsible for maintaining best practices to help businesses reach their targets. Ultimately, the PMO is an entity that assists the executive management of a business to translate strategy into results (Source: PMI). The PMO could be described as an orchestra conductor; setting the pace, coordinating timing and resources, and skilfully directing projects to run their course in the most effective and cohesive way possible, whilst avoiding any disharmony.


The key responsibilities of the PMO evolves over the main stages of project delivery, but always plays a key role in ensuring that projects are vetted to pass through the next stage-gate, and that they don’t stall along the way.

Key attributes of a high performing PMO:

  • The right mix of skills and experience to support the effective delivery of valuable opportunities for the business.
  • Willing and able to provide effective change management throughout any project or programme to ensure successful execution, as change management is a crucial component in any successful project implementation.
  • Delivery assurance through persistency and status reporting results in amplified success rates and assists with resource optimisation.
  • The PMO that cultivates a diversified team with an array of skill sets can see the benefits of transdisciplinary work come to fruition by providing holistic solutions.
  • Conduct regular project debrief reviews to identify lessons learned and guarantee independency between project management, project team and client. (Source: PMI)


Challenges faced by a PMO:

  • Keeping up to date with constant developments as business capabilities evolve requires fast-paced response rates, which can sometimes impact the quality of outputs.
  • While the PMO is great at task management and reaching projected goals, lacking access to real-time cost data can be detrimental to performance.
  • Limited access to information such as current project KPI’s can result in poor resource management and allocation.
  • A crucial skill of the PMO is to anticipate outcomes before they occur and mitigate undesired experiences. Failure to anticipate correctly can see things go pear-shaped.


The burning question is, is there something out there currently that can tackle these challenges and aid the PMO to be as effective as possible?

Pacific Consulting Group’s MakeItHappen cloud-based solution provides PMO’s with all the information and capability and deliver projects successfully. The portfolio workflow software allows PMO’s to manage tasks, customise workflows, and automate business workflows. Using Programme Management Software will be a game-changer for your PMO. Want to learn more? Book a MakeItHappen demo here.


Key Features to Look for in a Project Management Tool

Implementing the right project management software should make planning, executing, and monitoring initiative progress a breeze. They create a single source of truth and transparency, so that all stakeholders have visibility into the progress of each initiative and where key resources are allocated. With a range of features including flexible project views, as well as analytics, project tracking and resourcing, project management software is critical for creating a smooth workflow within your business. When you start to think about implementing projects, it’s important that you choose the best project management tool for your team.

Additionally, organisations that invest in project management tools save 28x more money than organisations that do not, and 77% of high-performing businesses use project management tools (Source: PMI).

What Is A Project Management Tool?

A project management tool is software that help teams plan, manage, and optimise resources across an organisation. The key features of any project management tool are:

  •  Task tracking and assigning – A key feature of any project management tool is the ability to assign and track tasks across their lifecycle.
  • Initiative Subcategories – These tasks need to be assigned to specific initiatives, so most project management tools have both parent initiatives (a large-scale initiative that smaller initiatives fall under), and child initiatives (the smaller initiative that falls under the parent).
  • Collaboration and Accountability – Project management software allows enterprise-wide collaboration on key tasks, and accountability through the ability to monitor how each initiative is progressing.

Why use a Project Management Tool?

Choosing the right Project management tool is critical for organisations to ensure a project is successfully implemented from concept through to delivery. A project management tool can also help keep teams stay organised and ensure that processes are followed and provide a clear overview of all activity happening in relation to an initiative, project, or task at any given time. Cloud-based project management tools also allow teams to communicate clearly and quickly, in real time and from anywhere, which streamlines the process of remote working arrangements, saving the average employee up to 498 hours per year (Source: PMI).

Key Features to look for in Project Management Software:

  • Team Collaboration – Simplifies collaboration and creates a virtual workplace, encouraging collaborative project planning and work-streams for all key stakeholders.
  • Task Management – Ability to assign and prioritise tasks by deadlines and importance, as well as the ability to automate notifications about task activities and deadlines.
  • Forward Planning – Break up large initiatives into smaller tasks and set clear goals and timelines to work towards. Define and manage requirements for each initiative. Schedule initiative duration, milestones, and deadlines.
  • Workload and Resource Management – Get an overview of current and upcoming work commitments across teams and projects. Assign team members and allocate resources based on availability and capacity. Ability to balance workloads amongst team members. Track project budget, cost-to-date and expected outcome per project.
  • Monitoring and Reporting – Overview to monitor how all initiatives are performing. Dashboard that provides an instant overview of each initiative, status, progress, and performance. Centralised data that provides a single source of truth for reporting. Identify issues and manage any risks.

MakeItHappen is a cloud-based programme and project management solution that allows organisations to effectively manage and deliver large volumes of projects. It ticks all the boxes for a leading project management solution, including collaboration, task management, tracking, reporting, and many more.

Get a demo of MakeItHappen to learn how it can help your business deliver more value from projects.

Click here to book a demo today.

Keep Your Transformation Initiatives on Track

Want to ensure your transformation initiatives stay on track? The importance of an enterprise-wide single source of truth for large-scale change programmes cannot be understated.

Identifying and implementing transformation initiatives across your business requires a large investment of time, cost and employee focus but is essential to maintaining and improving overall results.

Implementing these initiatives successfully can be challenging, and so too can be tracking and monitoring their performance. It is essential to implement measures to monitor the health of your initiatives at each individual stage, to ensure that each target identified can be tracked and updated by all key stakeholders at any time. Creating accountability and transparency on the health and status of each initiative will help keep your transformation programme on track and help to identify which initiatives are running well, and which initiatives may be slipping and in need of support.

PCG’s Cloud Programme Management platform MakeItHappen provides enterprise-wide transparency into key transformation initiatives for all stakeholders, ensuring a single source of truth for large-scale programmes. Each initiative can be accessed or updated by all relevant employees (within clearly defined access rights to preserve integrity and confidentiality), creating transparency on the status of each initiative, and streamlining the process of tracking and reporting on the health of your transformation programme.

PCG’s MakeItHappen Solution has a proven track record of helping PMOs drive transformation programmes that deliver tangible results. Book a demo with a PCG Partner here: https://buff.ly/3lcloml


How Pacific Consulting Group uses Dimensional Profit Models to improve profitability

PCG Founder John Stathis interviews Managing Partner Christopher Kernahan and learn how DPMs can help businesses identify the true profitability of their customers and products.

Watch the video or read the transcript below.

Transcript

John: Hi, I’m John Stathis, the founder of Pacific Consulting Group. I’m here today with Christopher Kernahan, the Managing Partner. Welcome Chris.

Chris: Thank you John.

John:  We’re here to talk about dimensional profitability modelling and how we use it to drive initiatives and results across our client base. Chris, why don’t you start off by telling us what is a dimensional profit model?

Chris: We look at dimensional profitability models as the modern equivalent to activity based costing models. But, whereas in the past they were heavily manual, surveys and interviews, in order to generate that data. Today, we have the benefit of operational equipment, the internet of things, where all of these assets are producing information. Whether they’re vehicles, sites, stores, forklifts and we’re leveraging that data, combining it with our customer and financial information to give us a granular insight into profitability, across customers, products, geographies, whichever dimension we need.

John:  Chris, why do our clients need the DPM and what are the benefits they can extract from it?

Chris: Let’s say you’re a hairdresser, you’ve only got two clients. Client A comes in and they just want a simple haircut. They’re in and out in 30 minutes. Client B, they want a cut, they want a colour, they want a wash, a shampoo or massage, they want a nice chair, premium products to put in their hair. Those extra costs, if you don’t identify them, you won’t know where your profit is coming from and you won’t know which of your customers are profitable and unprofitable. And that’s what the DPM does.

John: So it gives you a granular understanding of cross subsidization, across different dimensions of the business.

Chris: Exactly.

John:  Which industries benefit the most from a DPM?

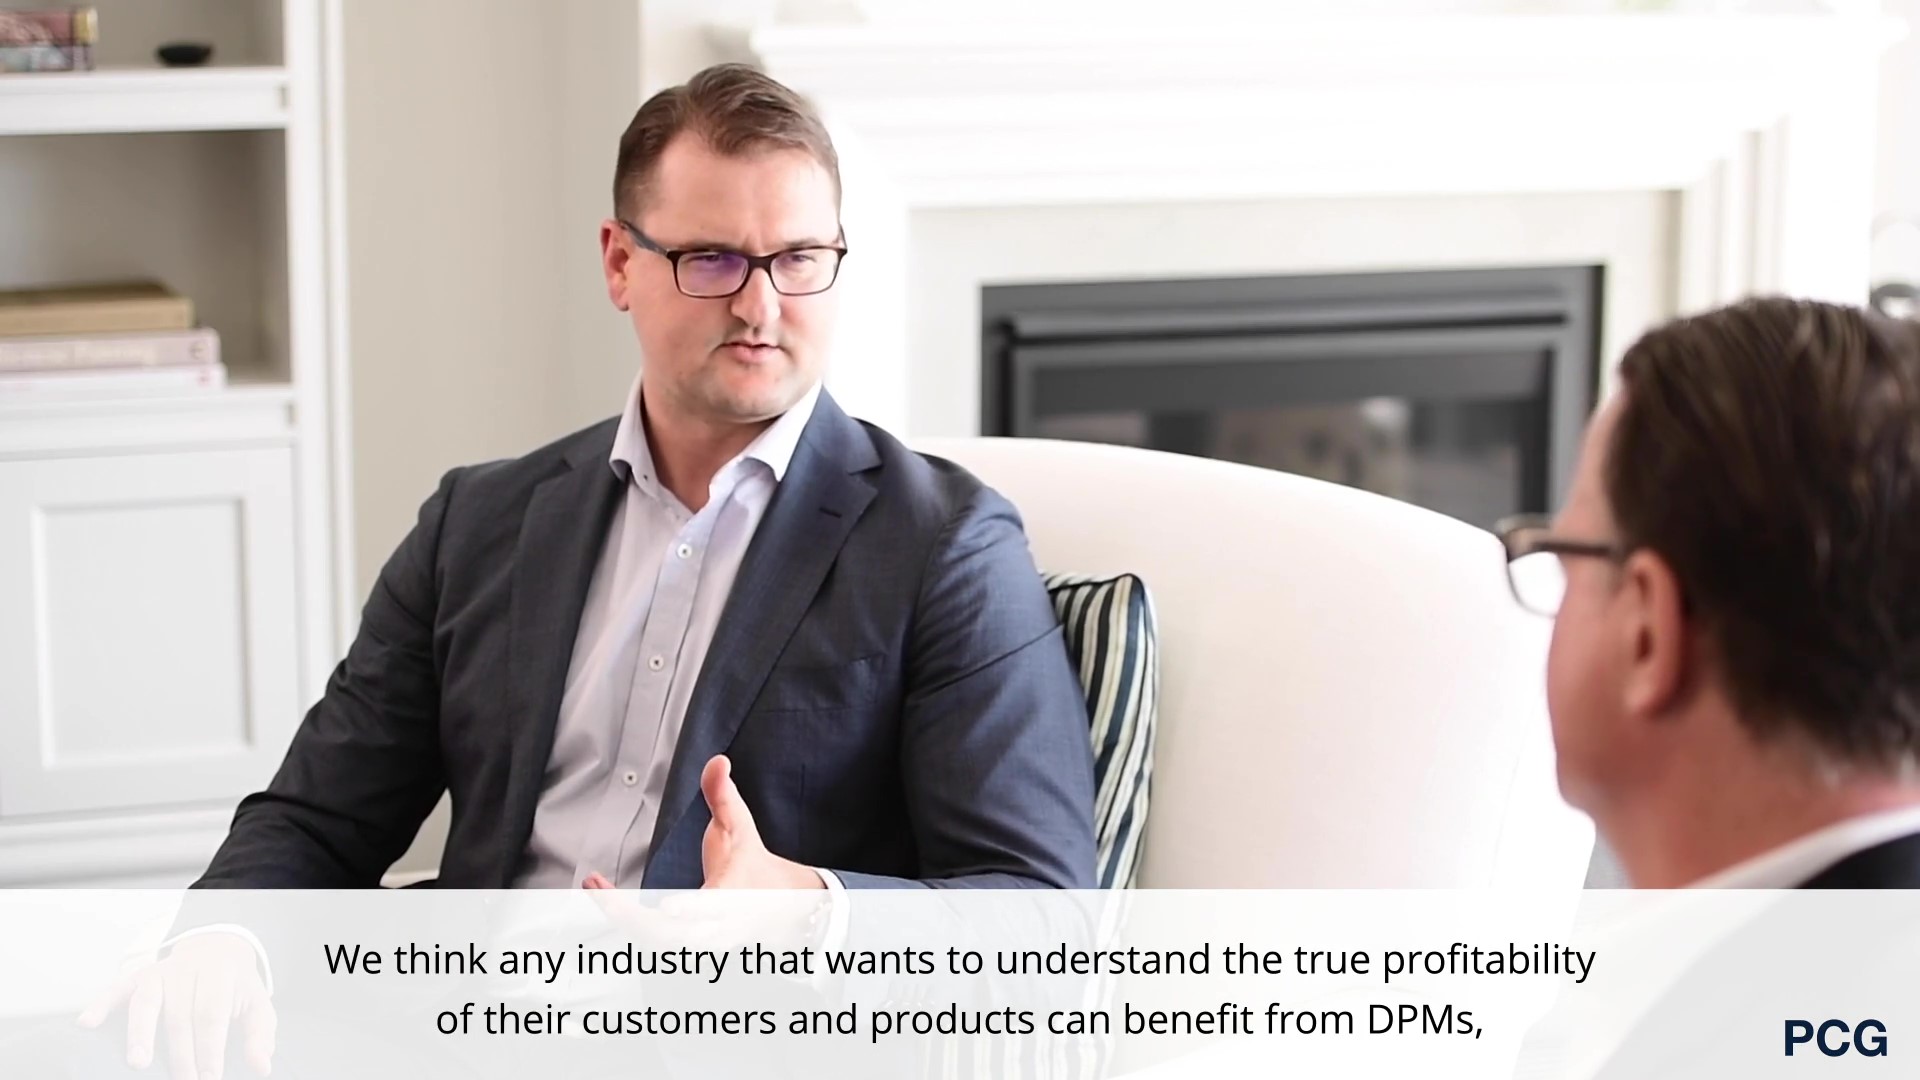
Chris: We think any industry that wants to understand the true profitability of their customers and products can benefit from DPMs, but we’ve seen particular effectiveness in businesses that are price makers, whether that’s consumer goods and retail, financial services. Also in freight and logistics, and even heavy industrials, that both produce and distribute their own products.

John:  Once you’ve built a DPM, what platform does it sit in when you transition it to the client’s environment?

Chris: As you know, John, PCG solutions is platform agnostic. We’ve worked with all of the major platforms that are in use today, but we’ve been particularly effective with a platform called MODLR. MODLR has both a cubing engine and a database engine in the same solution. And that lets us build these very rapidly and get to those insights in a matter of sometimes weeks.

John:  That’s impressive. Well, you’ve heard it from Christopher Kernahan. If you’re a CEO or a CFO, and you really want to get a granular understanding of profitability across any dimension of your business, so you can drive very specific initiatives.

John:  Chris, thanks for coming today.

Chris: Thanks John.

The very model of corporate profitability – feature in Australian Financial Review

Technology and data science have made operational and customer data more readily available, yet there remain companies that don’t understand the “true profitability” of their customers and products.

Christopher Kernahan, Managing Partner, outlined in the Australian Financial Review how Pacific Consulting Group’s data-driven profit improvement approach using Dimensional Profit Models (DPMs) can help companies create this important understanding.

“We see companies, even today, using averages of averages as a means of allocating costs to customers and thinking that they have an accurate understanding of profitability,” he says.

“Your least profitable customer can be three to five times as unprofitable as the average profitable customer. It is essential to have visibility into this because otherwise a whole range of decisions – pricing, investments, marketing – will be based on flawed assumptions.”

PCG has developed a Dimensional Profit Model (DPM) – a successor to activity-based costing – that provides companies with a methodology to “cohesively integrate financial, operational and customer data”.

DPMs utilise the abundance of automated data from operational assets such as scanners, stores and processing equipment to generate detailed cost allocations for different activities. Profitability can then be understood by various dimensions, including customer, product, channel and geography.

John Stathis, founder and chairman of PCG, says PCG developed its DPM a decade ago when it was engaged by a company in danger of collapse.

“They had suffered a $50 million loss the year before and could not understand why. We built a DPM with them and it completely changed their perspective,” he recalls.

“Before the DPM they had focused on collecting data site by site, process by process. With the DPM connecting all these sites and processes into a single model we were able to demonstrate the full flow of customers through their operations and highlight the highly unprofitable segments that were driving them out of business.”

The insights formed the basis of a successful three-year turnaround program.

Read the full article here.

PCG eCommerce Shipping Report

The Australian eCommerce sector has undergone dramatic growth in the past few years, fuelled by increasing consumer comfort with online spending and the entrance of Amazon driving significant investment and innovation. Whilst there has been an explosion in online offerings, from fast fashion to multi-product marketplaces, there has been comparatively less focus on the fundamental problem of getting the goods to the end consumer. For example, most Australians still experience a 2-5 day service as their primary shipping experience.

In the next few years we forecast significant innovation in shipping options, from an expansion in the number of shippers offering same day and express services, to a move to supply from store instead of DCs, ‘Need it Now’ deliveries of 1-2 hours, and the use of autonomous vehicles and drones for the last mile.

Our prior research has shown the importance of shipping to the overall customer experience, but to date there hasn’t been a focused analysis of eCommerce shipping trends in the Australian domestic market. Our eCommerce Shipping Report fills that gap. We have analysed in detail the current shipping options and offers provided by our largest eCommerce shippers. The findings of our report can be used by all eCommerce shippers to benchmark their offerings against their peers, and by logistics providers to identify further opportunities for their own portfolios and service offerings.

You can download a summary of the report here.

How do we get ready for a dimensional profitability model?

Introduction

Most freight and logistics companies know the importance of understanding the profitability of their products, customers, and operations at a granular level.

There’s good reason for this.

Freight and logistics companies know that size and complexity of their customer base and operations provides ample opportunities for inefficiencies and unprofitability to hide. They know that by using high level models, or none at all, they have limited ability to confidently identify pockets of profitability amongst customers, products, operations, lanes, weight bands, and so on.

They know that unless they have accurately modelled their operations at a granular level, they will be managing by averages. Averaging costs across large groups of customers and areas of the operation guarantees that, at scale, they will not be able to tell good customers from bad, or efficient operations from inefficient ones.

But despite recognising the benefits of a multi-dimensional understanding of profitability, fewer than 20% of companies are using a profit model. Many companies tell us it is difficult to ensure that their profit model is are accurate, that it is difficult to keep it up to date, to know how much to invest in developing it, or how to earn a return on this investment. It’s easy to make mistakes that have disastrous consequences.

Consider the road taken by one national freight and logistics operator. Following five years of growth in revenue and profit, they experienced a sudden drop in both. Management were at a loss to diagnose the underlying cause – was it all due to lingering effects of the global financial crisis? Were their largest customers strangling them with their pricing power? Or was it that their smallest customers who were walking out the door were actually their most profitable? They knew they needed a solid fact base to tell them which of their products, customers, geographies, and operations were profitable. But just at the time that they most needed insights, they received news that their head office was starting a global profit model project. This programme would involve all regions feeding their data into a model specified and controlled by the group Revenue Management Office.

Months elapsed. Time and resources were devoted to developing frameworks aligned to the head office view of the world, but had little relevance to or buy-in from the local company. As the head office programme ticked along, consulting and designing, and results continued to deteriorate, local management knew that they needed to take matters into their own hands before it was too late. They developed their own model in a rapid skunkworks project and began implementing profit improvement initiatives. Once global head office saw the value that they had added to the business, they were given leave to opt-out of the global programme and expand the scope and resources of their successful local model.

This is not an unusual experience. Many companies fail at this process. But for the many that fail, we have also seen phenomenal successes. Companies have used profit models to turn around their businesses, doubling or tripling their EBITDA, and adding multiple percentage points to their Return on Sales.

Our work with hundreds of companies across logistics and other sectors has helped them navigate the road to a granular understanding of profitability, and shown them how to use these insights to significantly increase revenue and yield, reduce costs, and improve productivity. Many of our clients have witnessed the power of the virtuous cycle from a DPM process.

Having directed or supported DPM engagements of all kinds, including turning around those endeavours that have stalled, PCG has identified many of the reasons why some profit model projects deliver significant results and others fail to make an impact. We have codified these learnings into an end-to-end DPM process.

One of the lessons we have observed is that, when the implementation of a DPM has not been successful, it is usually because the company has taken one of two roads. They have leapt into it without consideration and found themselves bogged down in things like the complexities of edge-case allocations, or they have turned it into a large-scale long-term project, failed to make short-term progress, and lost the support of the executive and operating team.

One of our key observations is that the DPM projects that deliver the best results in the shortest amount of time start with a clear understanding of the capabilities of the company and where they want to get to in the near and medium-term future.

For our clients, the first step in a DPM process is to understand what their capabilities and opportunities are today, where they want to go tomorrow, and develop the plan to bridge the two.

In this whitepaper, we share the details of this structured diagnostic process in the hope that more companies will commence their journey having developed a rigorous starting point.

What is a Dimensional Profit Model (DPM)?

DPMs are advanced cost allocation models which aim to connect customer, product, financial, and operational information using data-driven allocations or direct cost tracing. They avoid the averaging of costs based on proxies such as revenue, consignments, or items, and instead use operational modelling or direct cost tracing to allocate work effort involved directly to the items and consignments that consume resources.

The basic purpose of cost allocation models is to connect activities with the costs that they generate. Without accurate costing, there will be cross-subsidisation of costs. Customers who generate the most cost will be subsidised by other customers because of the averaging of costs across all customers. The organisation will be unable to make intelligent decisions about where to grow, where to change, and where to exit.

Diagnosis, DPM

DPMs are complex beasts.

A high quality DPM will draw together customer metadata, detailed financial data, second by second event data from operating equipment, and a range of other inputs to provide a comprehensive dimensional view of the business.

The broad questions that the diagnostic should seek to answer are:

  1.      Where do you want to go?
  2.      What is your current capability?
  3.      What is your investment pipeline?
  4.      Where are the gaps?
  5.      What investments will close the gaps and what is the implementation plan?

For each of these questions we have developed a set of diagnostic tools to support the process.

Step 1: Where do you want to go?

Expert operators can use a high-quality DPM to make improvements across their business, ranging from pricing and yield initiatives to supporting network investment decisions. Some of these uses include:

Pricing & Yield

Case study: A national parcels company updated their pricing for all customers once per year. Their approach was to apply the same change in rates to every customer. With the insights provided by a DPM, the company was able to segment their customers by profitability, and also take into account their history of price changes. These insights allowed them to target customer populations differently; increasing prices for those customers who were unprofitable or misusing the network, and lowering prices for highly attractive customer segments to support retention.

Example uses:

  • Dimensional profitability analysis, for example profit by product, customer, lane, item weight band, coincidenceof pickup or delivery.
  • Customer segmentation based on profitability, freight profile, network usage.
  • Pricing analysis, for example comparing price differences in price per kilogram by customer or product.

Productivity

Case study: Despite an abundance of operational event data generated by processing assets and hand-held scanners, a global freight carrier did not have a rigorous approach to evaluating the performance of their various sites. During the scoping for a new DPM, they were able to leverage the work done to clearly define the performance measures for each site and the data that could support this kind of analysis. Once the model was in prototype, they leveraged the DPM’s view of the event data to create leader boards which allowed them to start improving performance standards for unproductive sites to minimum levels of their peers.

Example uses:

  • Productivity analysis for major operating functions like linehaul, processing, and pickup and delivery. For example, supporting daily and weekly reviews of pickup and delivery vehicle fleet productivity.

Sales force effectiveness

Case study: One freight and logistics company was frustrated with the outcomes from incentivising their sales force based on new business revenue. Their top line was growing but so was their cost of freight, because the freight profile of the new business was low quality. Using the output from a DPM, the company could clearly see the link between the low quality of the new business compared to their existing portfolio. They changed selling incentives to include a gross margin measure. This ensured that the sellers were incentivised to win business that didn’t have a negative impact on operational performance.

Example uses:

  • Sales force leader boards based on profitability and freight profile quality.
  • Tracking changes in profitability across sales territories and customer cohorts.

Network investment

Case study: The product of many years of acquisitive growth, one national logistics operator was facing the challenge of integrating their many networks to improve service and efficiency. In order to make investment and rationalisation decisions, they turned to their DPM to compare productivity across the networks. They were able to highlight asset and sub-network aspects such as high productivity or apparent excess capacity. The integrated nature of the DPM allowed them to make confident decisions in the context of current and required future profitability.

Example uses:

  • Identify intra-network streaming opportunities by allowing least-cost/highest-productivity comparison across functions and transport modes.
  • Supporting business cases for further investment in scanning and operating equipment by accurately showing the size of prize.

Clearly, there are a broad range of uses for a mature DPM, and senior management need to be aware of the universe of possibilities for putting the DPM to use so that they believe in the value of the project and provide it with their support.

However, they also need to be aware of two key learnings from failed DPM projects. DPM projects fail because they try to:

  • model the whole business from day one, and/or
  • build a model that supports every use case from day one.

There is a significant ramp up in the effort required to mature a DPM to an advanced level: more data, more complexity, more sophisticated uses that need to be supported. Therefore, companies can give their DPM projects a better chance of success by deciding up front:

  1. Which parts of the business would they like the DPM to cover,
  2. What uses do they want their DPM to be able to support, and
  3. In what order of priority do they need it?

In general, focus can be achieved using the 80:20 rule or by starting with the largest standardised service offering. For use cases, the value to the company may be self-evident, the senior leadership team may express a strong preference, or the options can be force ranked to achieve a priority listing. By agreeing these upfront and by defining their priority, the DPM will be focused on a clear set of targets that are highly valuable to the business.

Step 2: What is your current capability?

In this step the diagnostic develops a clear picture of the current capabilities of a company, and what these capabilities could deliver if a DPM were to be implemented.

Firstly, it is important to understand what makes a high-quality DPM.

As mentioned earlier, a DPM is a highly advanced cost allocation model, so it follows that the model is made up of allocations. At a basic level, allocations take the various costs of operating a business and spread them across the products and customers of that business.

The quality of the allocations drives the quality of the model. Allocation quality includes attributes like the accuracy, precision, granularity, scope, and timeliness of the data, and the strength of causality between an activity and the allocation of cost.

Consider this example; a freight company that provides a specialised, segregated help desk to its largest customers. The DPM might be said to have a high-quality allocation of customer service costs if it directly allocates the costs of this help desk to the large customers using this service. There is a clear causal link between the two.

In contrast, the model would have a low-quality allocation of customer service costs if the cost of this dedicated help desk was bundled up with the general customer service cost pool, and allocated equally to every customer. Although there is some connection between the customer activity and the cost, it is weak. Because it is weak, it limits the ability of someone using the model the generate insights and initiatives that can be relied upon.With this in mind, each component needs to be reviewed to identify the most significant capabilities that are currently present which could either support or limit the level of quality of a DPM.

undefined

The stages of allocation quality

Allocations can be ranked from Stage 1 to Stage 4, based on their Degree of Accuracy and the Degree of Effort to implement and maintain.

In general, a high-quality DPM would have Stage 3 or Stage 4 allocations for the major components of the cost of freight, and could attempt the same level for major overhead costs such as sales and customer service.

How do you determine what a ‘capability’ is?

Making this determination is not an exact science, and there is some art in deciding what constitutes a significant capability. Often, it is about documenting what is known about the operational processes by subject matter experts.

By way of example, at one company it became apparent from interviewing subject matter experts that some of their allocations would only be a Stage 1 allocation. This was because there was no detailed tracking of the method by which items entered the company’s network, so they couldn’t assign these costs directly to customers.

In making the assessment, consideration should be given to the level of quality that is supported by the:

Underlying cost pool. Granular allocations require granular financial data. If, for example, the financial data for Linehaul is consolidated so that the costs of different modes of transport are not separately visible, then this will limit the quality of the allocation to around Stage 2.

Activities or drivers. High-quality DPMs are directly connected to the company’s operational event data, such as the data streams from hand scanners used by delivery drivers. If this information is not available, it will be difficult to have high levels of confidence that the model reflects operating realities.

Once completed, senior management and key stakeholders will then have with a clear view of the level of quality of a DPM if the model were built based on the company’s current capabilities.

Step 3: What is your investment pipeline?

With a solid understanding of the company’s current capabilities, the next step is to understand the investment portfolio, both active and planned. This will help to identify which current gaps in capabilities will be improved in the near to medium-term, so that the DPM project can plan ahead to incorporate future changes.

The internal project management office should be able to provide a consolidated list of all active and planned projects. From this list, evaluate each project to determine the impacts. Some key questions are:

  • What products will it impact?
  • What types or segments of customers?
  • What areas of the operation?
  • Will it improve data availability?
  • What will be the quality impact? For example, will it allow us to create Stage 3 Data-Driven allocations?

Once this assessment has been completed, the current capabilities can be compared with future capabilities. This will provide a clear picture of the prospective improvements in capability by identifying any major model components that can be firmly relied upon because they will achieve a Stage 3 or Stage 4 allocation quality, either now or in the near future.

This provides confidence to senior management that investing in a DPM process will continue to provide benefits. As new capabilities and information is developed, a high-quality DPM can easily tap into these new feeds of information to continue to improve the quality of the insights it provides.

Step 4: Where are the gaps?

Once the current state assessment and the investment pipeline have been documented, we can compare the two to see where the areas of opportunity are.

It will be obvious from the results of Step 3 as to which components are more advanced than others. This information can be used to design a DPM process that leverages the current capabilities, while also providing input into the forward investment plan to ensure that weaker areas of understanding will be addressed in future.

It is important to note that having a DPM which can only achieve Stage 1 or 2 allocations can still provide value to a company. We have observed many DPM projects that still deliver significant value, despite being seemingly handicapped by limited organisational data. This is because the rigorous design process and search for data-driven insights can highlight previously undiscovered areas of value, or help to dismantle long-held beliefs that have no basis in reality.

Step 5: What investments will close the gaps and what is the implementation plan?

With our current and near-term plans mapped out, the business will have a clear fact base from which to support a DPM process. They will understand current and planned future capabilities, and have identified the gaps in their capabilities. Having completed this process, the business may have identified capability gaps or opportunities to improve understanding across such areas as customer and product, network, systems and processes, and people. With these analyses completed, the project team and senior management can work to jointly agree a revised investment roadmap which supports a DPM implementation plan.

Finally, an improvement option for the PMO to consider is to start evaluating project proposals and business cases using a DPM lens. It could be made a part of project establishment that the project owner needs to document what contribution, if any, will be made to improving the ability of the organisation to understand itself. This information can be mapped against the major model components and be used as a project prioritisation measure. Projects which contribute significantly to improvements in information quality may be considered a higher priority than those that do not contribute, or detract from, the level of understanding.

Conclusion

Start right finish right

We have seen the power of successfully implemented DPMs, and how widely the positive impacts of the process spread across the business. We have also observed DPM processes done poorly, and know the costs of failure.

A structured diagnostic can help ensure that any future DPM project will be successful by identifying up-front the likely quality of the model and the areas where there are likely to be issues in developing a solid understanding of profitability. As an added benefit, it provides a clear view of capabilities, which can be used to direct investments where they will have greater impact in contributing to the understanding of the organisation.

How can PCG help you understand and improve your business?

The differences between beginners and expert competitors when it comes to DPMs are stark.

Experts are using DPMs to support initiatives across revenue management, operational productivity improvement, sales force effectiveness, and many other major profit and productivity improvement initiatives. They have the confidence to act because the DPM has become a trusted source of truth for all major functions in the business.

Having directed or supported hundreds of DPM engagements, including turning around those endeavours that have stalled, PCG have developed the expertise to confidently deliver DPM-based insights and initiatives for highly complex global and national freight and logistics companies. Contact us today to find out more about how we can add value to your business.

About Pacific Consulting Group’s Freight and Logistics practice

One of our core industry focuses, the Freight and Logistics practice has delivered profit and productivity improvement for leading companies around the world. We have worked in partnership with senior leaders across industry segments like parcel express, road/air/rail freight and intermodal providers, last-mile specialists, and 3PL. Our superior analytics, commercial focus, and industry experience have allowed us to deliver outstanding outcomes.